Object Detection Evaluation
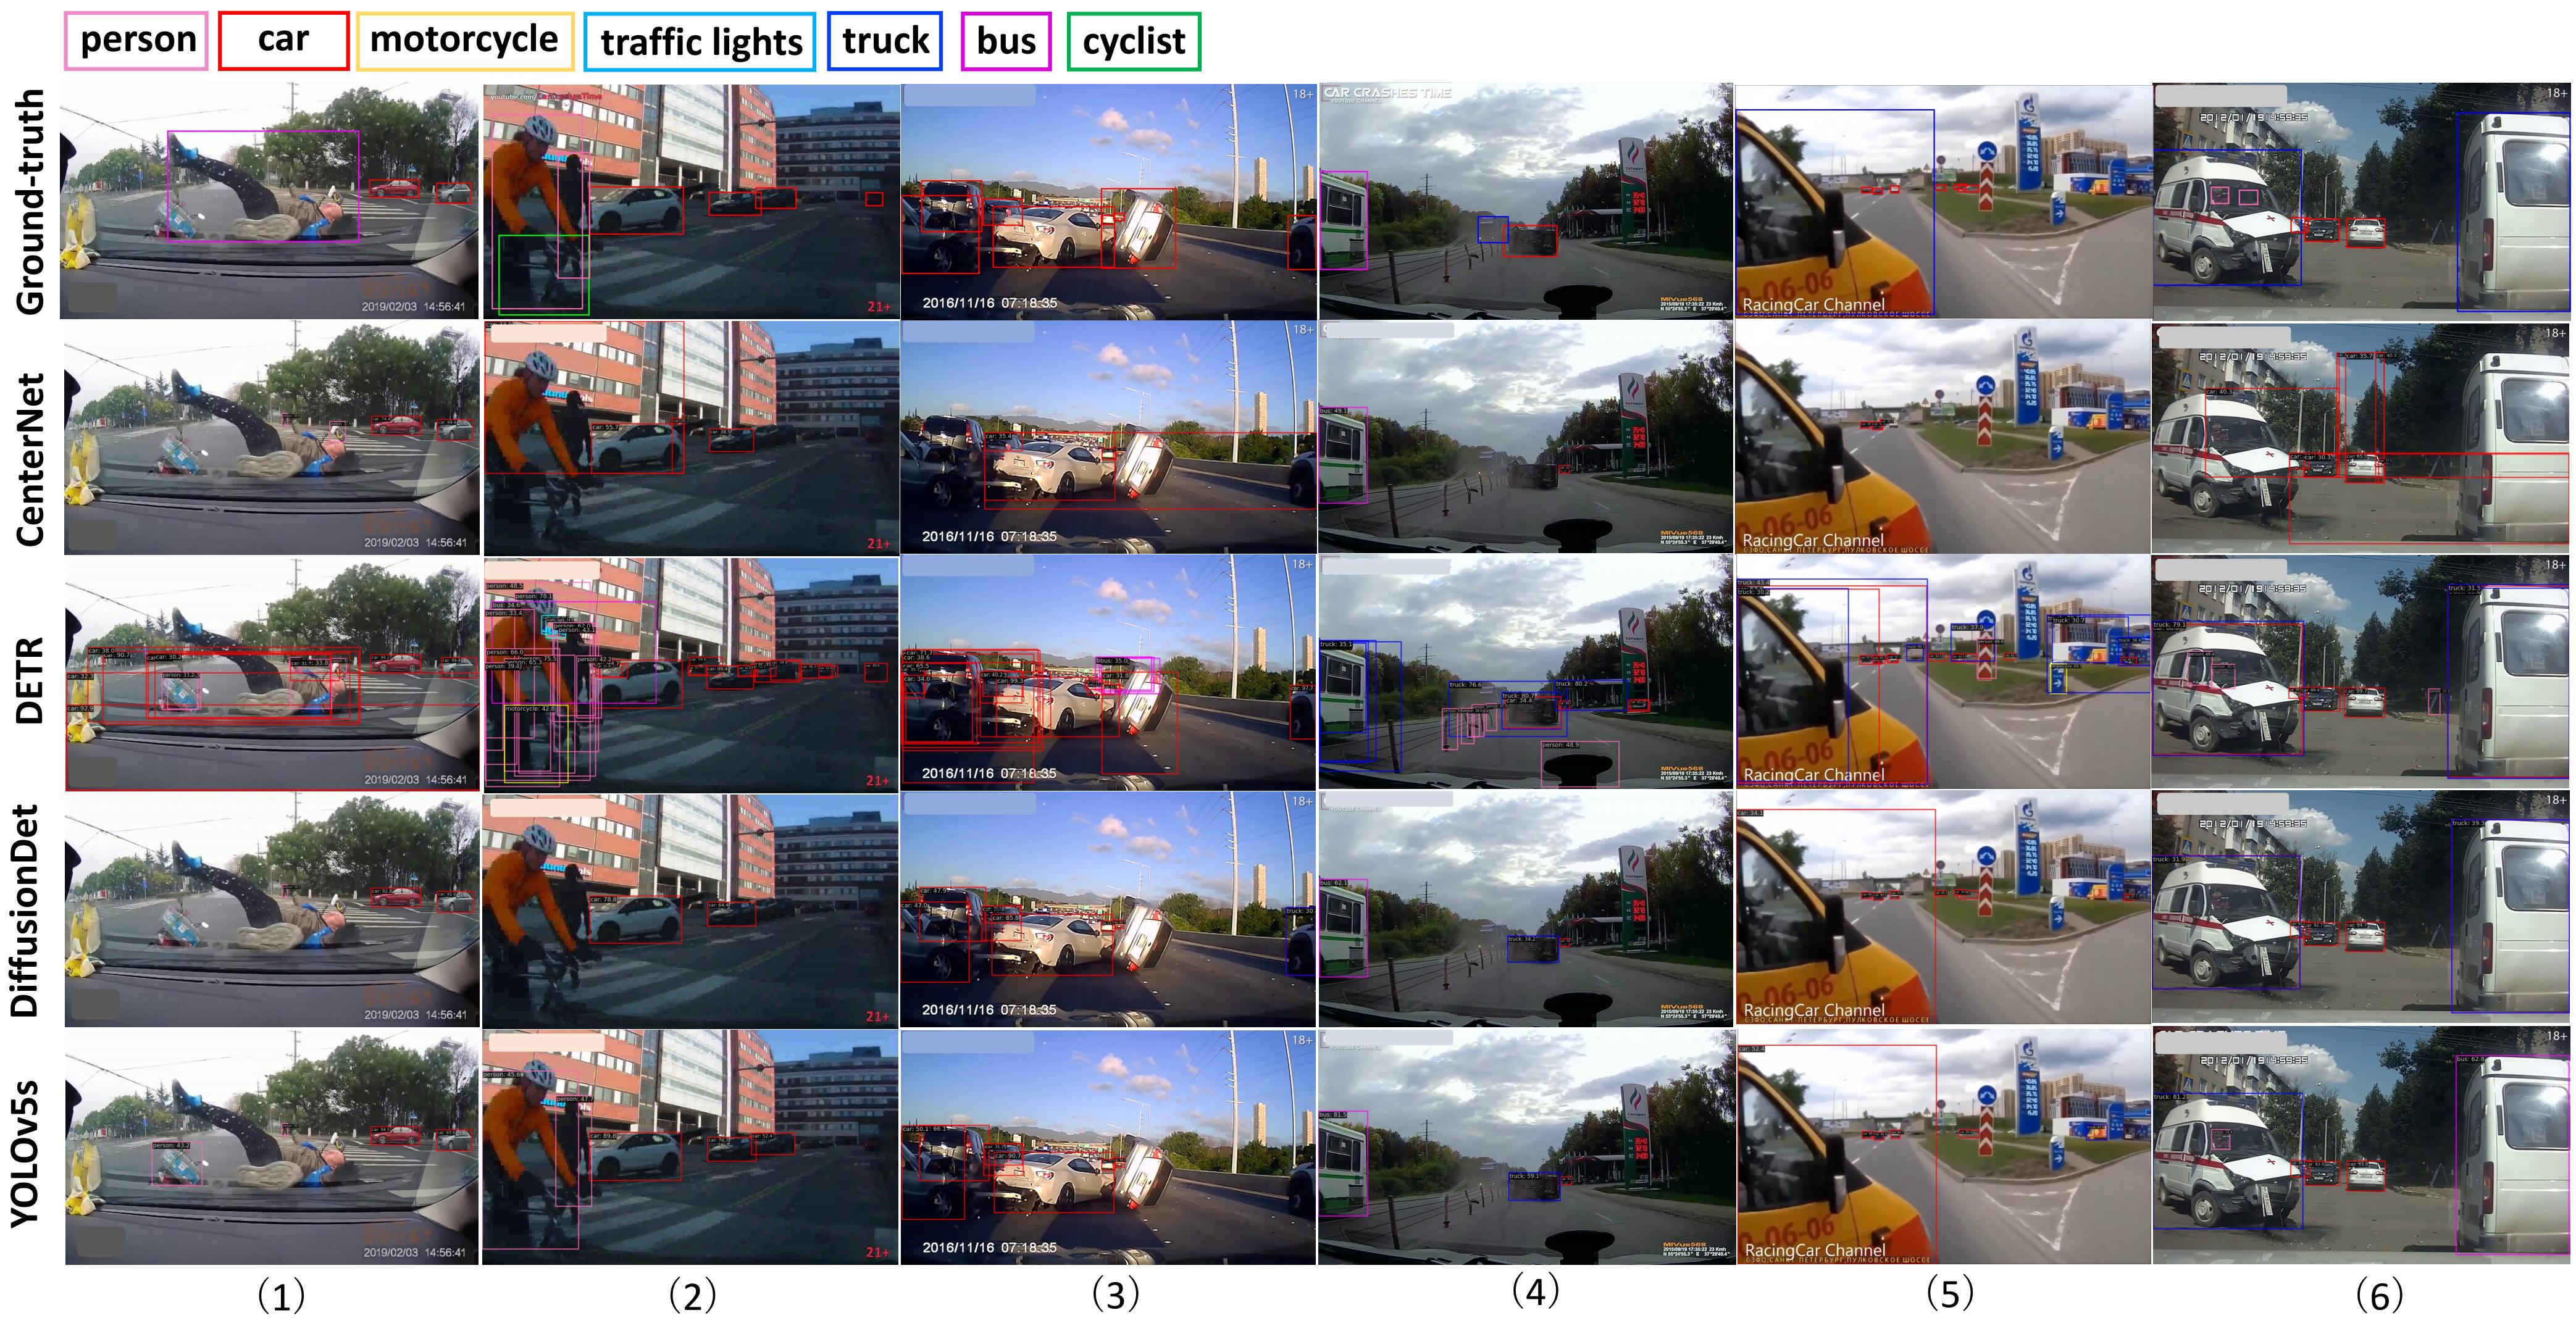
This is the 2D object detection benchmark. We annotate over 2.23M object boxes for about 463K video frames. The benchmark uses 2D bounding box overlapping rate to compute precision-recall curves for calculating the AP, mAP75, AP50, mAP75, AP_S, AP_M, and AP_L metrics in various pedestrian categories.
Leaderboard
| Detectors | Years | V1-Train [Vo, Vr, Va] | V2-Train [Vo, Vr] | Anchor | GFlops | #Params. | ||||||||
|---|---|---|---|---|---|---|---|---|---|---|---|---|---|---|
| val. [Vo, Vr, Va] | test. [Vo, Vr, Va] | test. [Va] | test. [Vo, Vr] | test. [Va] | ||||||||||
| mAP50 | AR | mAP50 | AR | mAP50 | AR | mAP50 | AR | mAP50 | AR | |||||
| FasterRCNN | 2015 | 0.674 | 0.634 | 0.666 | 0.623 | 0.664 | 0.620 | 0.544 | 0.524 | 0.497 | 0.509 | ✓ | 0.19T | 41.38M |
| CornerNet | 2018 | 0.495 | 0.625 | 0.485 | 0.619 | 0.483 | 0.624 | 0.436 | 0.563 | 0.456 | 0.598 | 0.71T | 201M | |
| CascadeRPN | 2019 | 0.662 | 0.699 | 0.664 | 0.696 | 0.649 | 0.689 | 0.579 | 0.663 | 0.532 | 0.624 | ✓ | 0.18T | 41.97M |
| CenterNet | 2019 | 0.054 | 0.238 | 0.051 | 0.233 | 0.047 | 0.224 | 0.161 | 0.260 | 0.155 | 0.257 | 20.38G | 14.21M | |
| DeTR | 2020 | 0.367 | 0.407 | 0.377 | 0.403 | 0.363 | 0.403 | 0.275 | 0.329 | 0.254 | 0.318 | 44.55G | 28.83M | |
| EfficientNet | 2020 | 0.310 | 0.417 | 0.310 | 0.412 | 0.293 | 0.404 | 0.075 | 0.128 | 0.073 | 0.133 | 57.28G | 18.46M | |
| Deformable-DETR | 2021 | 0.660 | 0.671 | 0.661 | 0.668 | 0.652 | 0.663 | 0.626 | 0.631 | 0.587 | 0.626 | 0.18T | 40.1M | |
| YOLOx | 2021 | 0.673 | 0.709 | 0.672 | 0.698 | 0.670 | 0.698 | 0.563 | 0.627 | 0.540 | 0.626 | 13.33G | 8.94M | |
| YOLOv5s | 2021 | 0.757 | 0.766 | 0.748 | 0.764 | 0.743 | 0.761 | 0.660 | 0.716 | 0.636 | 0.712 | ✓ | 8.13G | 12.35M |
| DiffusionDet | 2023 | 0.731 | 0.749 | 0.733 | 0.745 | 0.718 | 0.738 | 0.701 | 0.729 | 0.660 | 0.716 | - | 26.82M | |
| YOLOv8 | 2023 | 0.716 | 0.754 | 0.715 | 0.753 | 0.717 | 0.755 | 0.606 | 0.702 | 0.597 | 0.703 | 14.28G | 11.14M | |
| YOLOv11 | 2025 | 0.698 | 0.684 | 0.696 | 0.690 | 0.693 | 0.692 | 0.673 | 0.662 | 0.639 | 0.649 | 21.6G | 9.43M | |
| YOLO26 | 2025 | 0.716 | 0.752 | 0.713 | 0.758 | 0.710 | 0.760 | 0.682 | 0.708 | 0.646 | 0.695 | 22.5G | 9.95M | |
Submit Your Results
You can submit your metric values via the provided form. Furthermore, we would highly appreciate your contribution with clear links to relevant articles and code for more in-depth analysis.
Click here to submit your results:
Submit